This article covers the software that comes with the Bloodhound, and what it does for you. Included are the thick client desktop applications, and the thin-client web applications. This is only an overview of what’s included.
PREREQUSITES:
There are no prerequisites for this article. You do not even need to have received your Bloodhound yet.
GENERAL INFORMATION:
1) THICK CLIENT – BLOODHOUND USB DRIVERS: We mention these first only because these drivers are absolutely required in order to make the local USB connection to the Bloodhound. There is a full article on using these drivers and a USB Printer cable to connect your computer.
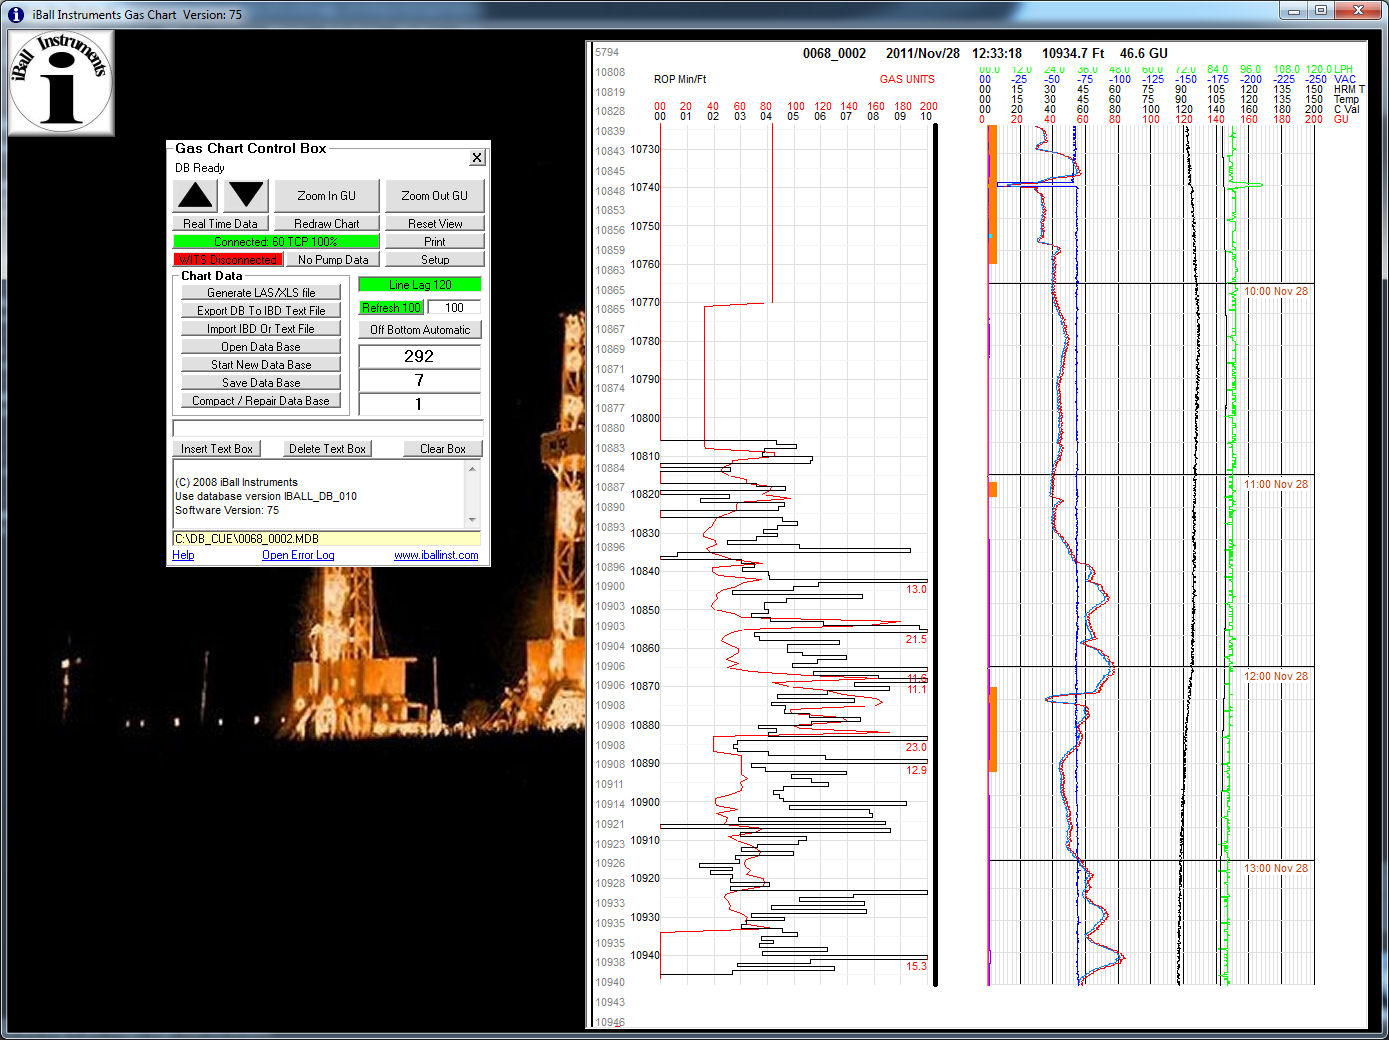
2) THICK CLIENT – IBALL INSTRUMENTS GAS CHART Gas Chart is perhaps the single most powerful piece of software for managing the Bloodhound on-site and remotely. It includes a real-time chart of the gas by both depth and time, and allows the charting of a number of other vital pieces of information about the well. In addition, it can be configured to chart various “troubleshooting” items, such as vacuum and flow rate over time.

Gas Chart is solely responsible for the calculation of Lag Depth with the Bloodhound, and it must be an instance of Gas Chart running on a computer next to the Bloodhound, connected via the USB cable.
On a final note, while Gas Chart does a lot more than we can put in this paragraph, it also is responsible for exporting ANSI standard LAS files which can be loaded into the vast majority of well-logging software packages out there.
When running, Gas Chart looks something like the screen capture below:
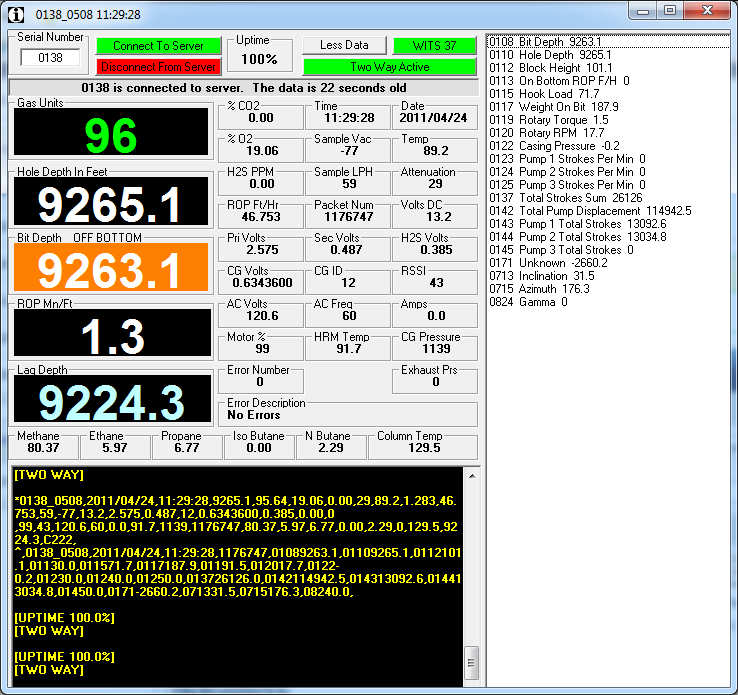
3) THICK CLIENT – STAND-ALONE REAL-TIME DATA VIEWER (RTDV): Used primarly as a remote admin thick client (meaning it has to be “installed” on the computer as opposed to running within a web site). RTDV can be used for a look at the equivelent of Gas Chart’s Real-Time Data window. It allows for a real-time look at the data on any connected Bloodhound, and with administrator credentials, allows access to the command-line interface (CLI) that can be used to change registers, set job numbers and depths, and a myriad of other tasks. RTDV looks similar to the following screen shot when running and fully expanded:

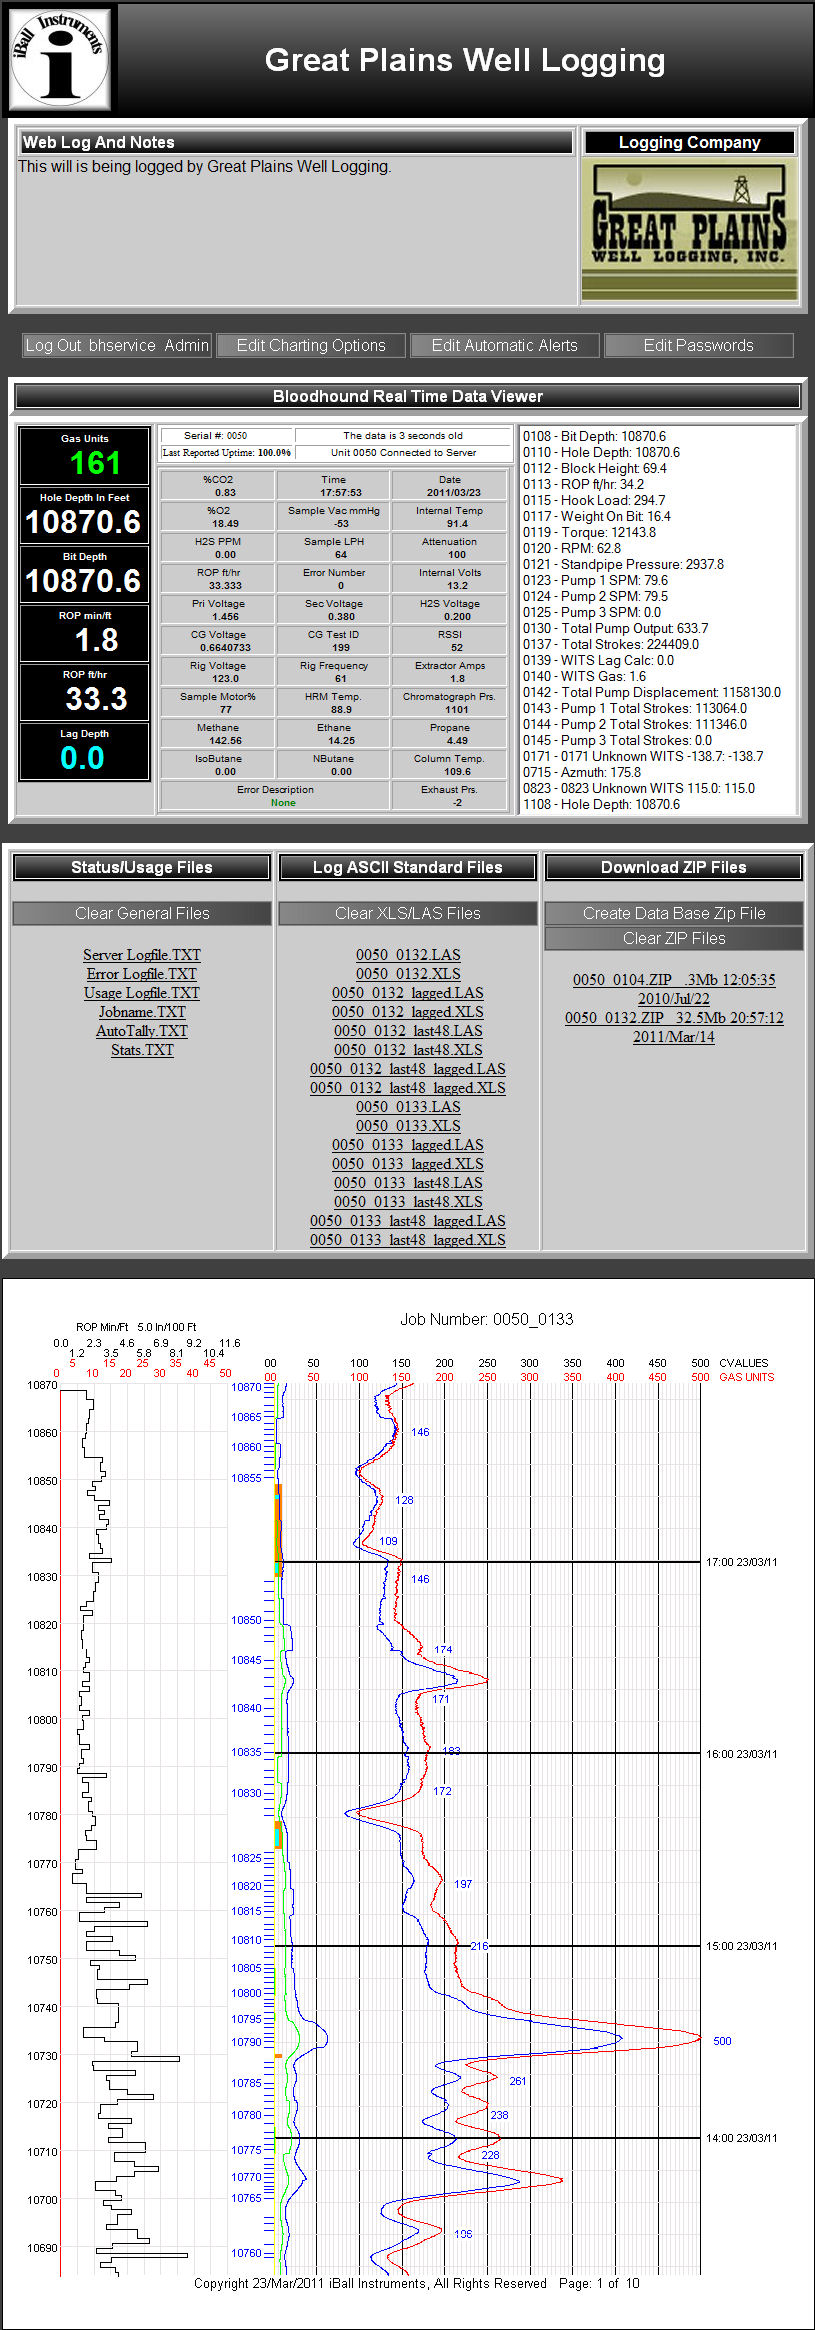
4) THIN CLIENT – IBALLREMOTE.COM: iBallRemote.com is an Internet web-page version of the Gas Chart software. While it is not capable of picking peaks or other advanced depth editing functions, it does a good job of displaying the charted progress of a well, and it serves as an excellent mechanism by which a customer can view the results of a well without having access to tamper with data or make changes to the Bloodhound. An example of iBallRemote’s screen is shown below ( NOTE: This screen is normall something you have to “scroll” your browser through – it is shown in total below):

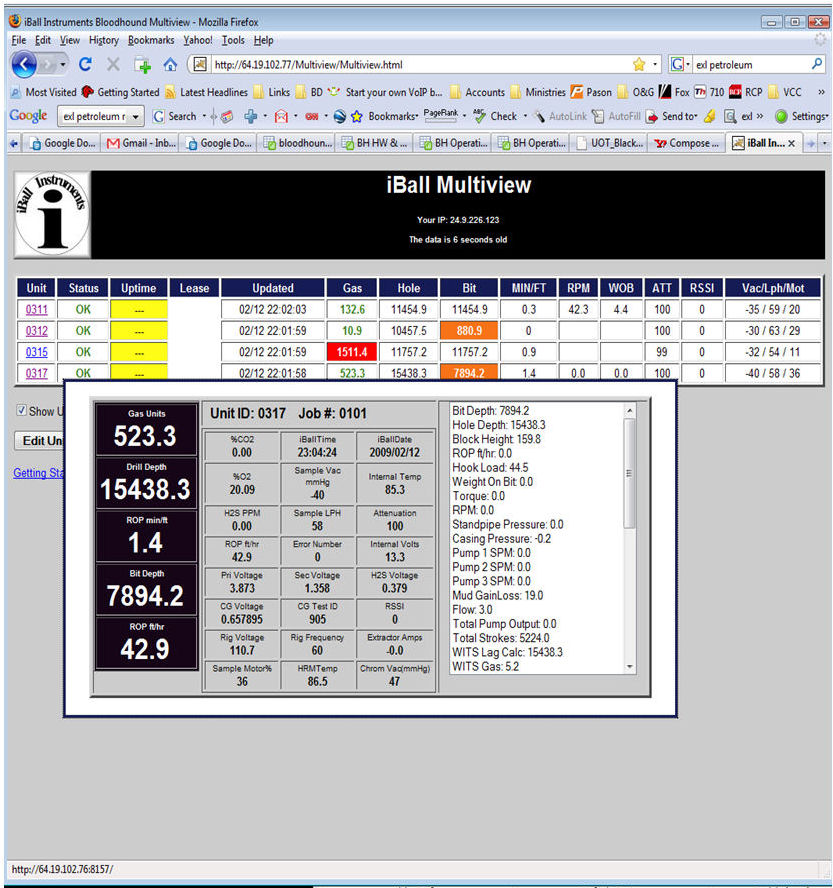
5) THIN CLIENT – IBALL MULTIVIEW: iBall Multiview is a web site that gives a “Dash Board” view of a number of Bloodhounds one or greater simultaneously. It was designed to be useful if you ware managing a number of Bloodhounds within a company, and want to get an overall view of the status of the Bloodhounds and the wells on which they operate.
iBall Multiview can also be used to access iBallremote.com for specific Bloodhounds in the list by “drilling into” the Bloodhound. An example of iBallMultiview’s screen is shown below:

6) BRSS IVR: The BRSS IVR is an interactive phone system that allows you to dial into the switch panel, and automatically retrieve depths and total gas numbers from your Bloodhound using any touch-tone phone. Simply call the number on the face of your Bloodhound, press option three (3) and follow the prompts. A server-side software package will look up your Bloodhound number, find the depths and total gas numbers, and these will be read to you on the phone. This is very useful when tripping, and/or remote monitoring on a temporary basis.
And that is a summary of the Software Packages that come with the Bloodhoung!