How to (Locally) Calibrate the Chromatograph or Pick Peaks for C-Values
This article instructs you on how to set your gas peaks using a locally-connected Gas Chart (via USB Cable) software package. By “Locally” what that means is doing it from the trailer where the Bloodhound is located.
PREREQUISITES:
1) You must be present at the Bloodhound to execute this test.
2) You must have an instance of iBall Instruments Gas Chart running and properly connected to the Bloodhound.
3) Your Gas Chart computer must be successfully connected using a USB Printer cable.
HOW-TO:
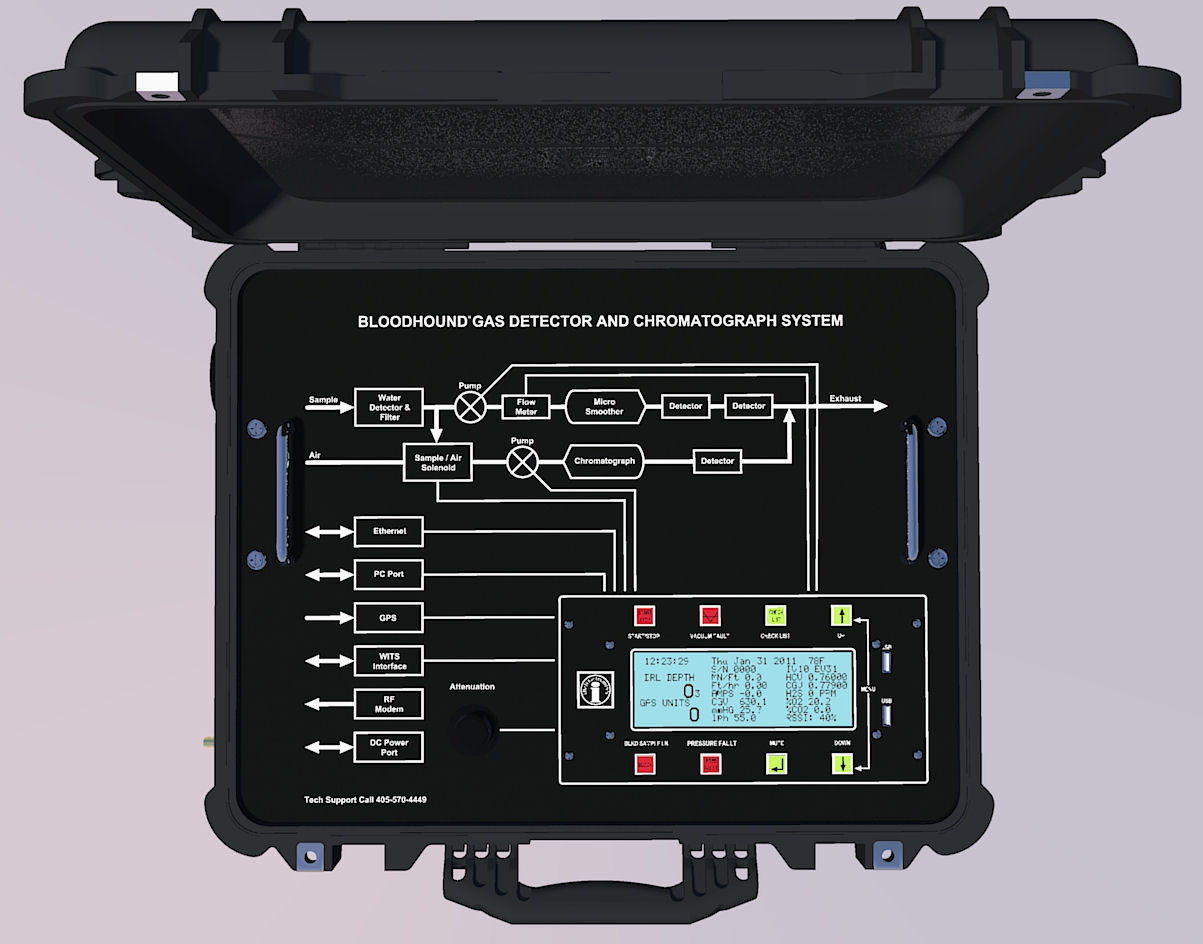
1) To understand why we have to pick peaks, it makes sense to get a little background on the Chromatograph: The Bloodhound Chromatograph is connected to the main sample line via a solenoid valve which opens periodically (once every 8 minutes by default) to take a “snapshot” of a sample from the main line. By default this solenoid opens for 5 seconds – so it’s a 5-second sample of gas that is pulled. From there, a second pump in the Bloodhound “pushes” the sample through the Chromatograph Column where it is then burned on a CC/TC filament. This route is illustrated on the face of the Bloodhound:

The column itself then separates the gases by their molecular weights, and the order in which they burn on the CC/TC filament is from lightest (Methane) to the heaviest the Bloodhound detects (Normal Butane). Each of these “burn-offs” produces an individual “spike” in heat on the CC/TC filament, and these are then equated to numbers or “peaks” over the 8-minute period that the sample is burning through the column. Understanding where these peaks occur, and calibrating the Bloodhound to understand which of these peaks equates to which gas is the process of “Picking Peaks”. Because outside temperature, natural variations in the column temperature, barometric pressure, altitude and others can affect the way these gases burn on the CC/TC filament, Picking Peaks is a common and normal calibration exercise that is very much a “tuning exercise” on the Bloodhound.
2) Ok, on to how we pick the peaks. First, look at Gas Chart. The left hand side of the chart is depth-based, and the right-hand side of the chart is time-based. We will be deailing with the time-based (right hand side) of the chart for this exercise.
3) Left Double-Click in the middle of the time-based chart.
4) Drag your mouse up or down and you will see a flashing single-pixel line following your mouse.
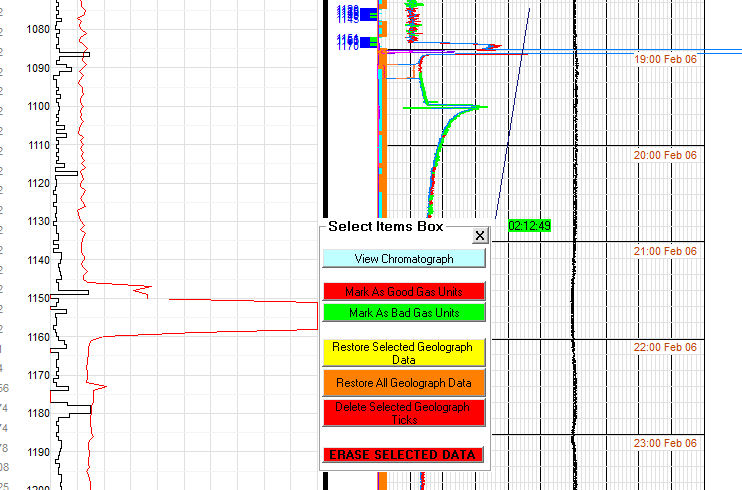
5) Left Double-Click again and a menu will pop up (see the image below).

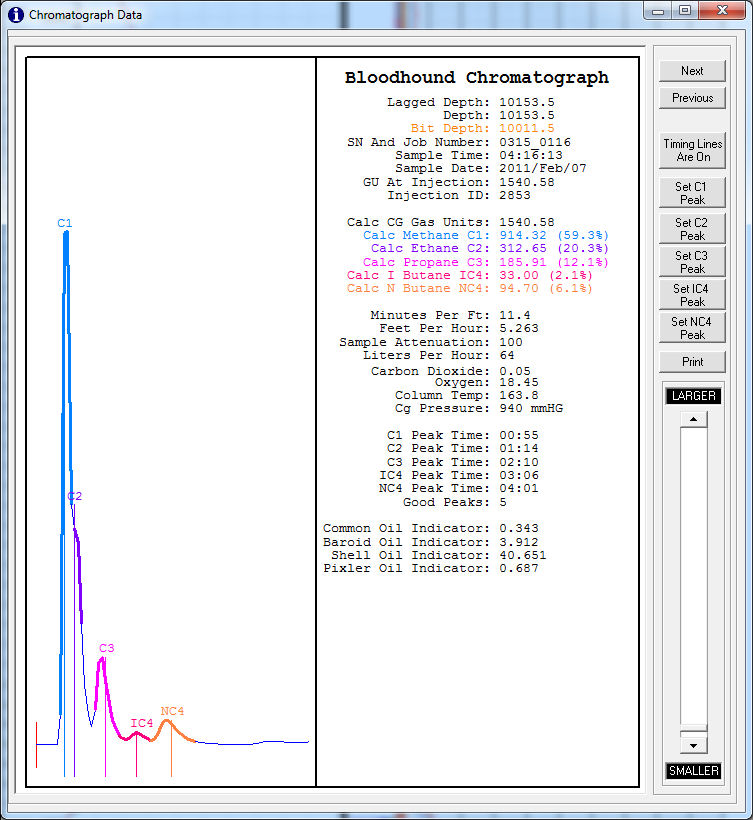
8) Click on the button that says “View Chromatograph” and you will get a pop-up window similar to the following figure:

DESCRIPTION OF VIEWS AND CONTROLS:
| DESCRIPTION | WHAT IT DOES |
| Left Hand Chart | From the left to the right, this chart represents 8 minutes – from the time that the Chromatograph opens the solenoid and pulls a sample from the inlet line, to the completed burn. You can move the chart up and down by left-clicking on it and dragging the mouse up or down, then releasing the button. |
| Colored Peaks in the Chart | These in order are Methane, Ethane, Propane, Iso-Butane, and Normal Butane. They burn off in the order of molecular weight (lightest to heaviest). |
| SN and Job Number | A secondary way to verify the Bloodhound’s Serial Number and the current Job Number set on the Bloodhound for this sample. |
| Sample Time and Sample Date | Important timestamp information for determing the time of the Sample Injection into the Chromatograph cycle. This is useful when running a Chromatograph Lighter Test on the Bloodhound. |
| Injection ID | A unique number that identifies the specific Sample injected into the Chromatograph circuit. This is very useful when working between two different computers, or with Bloodhound Support as the same injection ID will show the same data on both ends as long as the data is complete. |
| Gases 1 through 4 (colored) | The colors of the gases in the numerical fields, matches the colors of the peaks to the left. This is helpful in determining if the peaks are properly picked. |
| Column Temperature | Generally supposed to be set at 120, unless for some specific reason the user has changed it. |
| Next and Previous Buttons | These are used to traverse Sample Injections. Clicking next will go to the next 8 minute cycle and clicking previous will go to the prior, and so-on. |
| Timing Lines are On/Off Button | Used to turn on and off the colored lines (thick and thin) so you can view the absolute raw burn data if needed. |
| Set C1 through NC4 Peak Buttons | When you are either a) connected to the Bloodhound locally (via USB Cable) with a Gas Chart computer, or remotely connected and in “Two Way Active” mode (setup–>Bloodhound), these buttons will allow you to properly set peaks for the 5 gases identified. Click one of these buttons and move your mouse to the graph and you will get a vertical flashing line. Place the line directly over the very peak of the gas you want to ID, and left double-click the mouse to set the peak, and you’ll get a pop-up window with the number of seconds into the Chromatograph burn cycle at which the peak will be set. |
| Slider | The slider on the right is spefically used to scale the chart to the left. If, for example, the Methane is WAY off the top of the chart, use this to tone it down so you can see the peak and if necessary adjust it. |
12) You have to find a Chromatograph cycle that is recent, and represents a good breakout of the various gases you are reading. Observe the “Sample Time” and “Sample Date” and make sure you are in a recent range of time. Also take note of the “Next” and “Previous” buttons in the top-right portion of the screen. These are the buttons you use to go back and forth through Chromatograph cycles so you can go forward or backward in time/cycles in order to find one that is appropriate for a Peak Picking exercise. NOTE: The graph at the left represents from left to right the 8 minutes (by default) that the Chromatograph takes to burn through the sample injected by the solenoid we mentioned previously. So each of these that you go “Next” or “Previous” through represents 8 minutes.
13) The “slider” on the right will allow you to “scale” the graph – so if the methane is too high (off the chart) to pick peaks, slide this down until it comes into view.
14) You can move the graph up and down by left-clicking on it and dragging the mouse up or down and releasing the button, so for example if the graph is too low to see the heavies, just drag it up until they come into view.
15) Once you’ve found a good sample, we have to determine if each peak needs to be calibrated. There is a thick, colored line which traverses the peak for each “color” or gas noted in the right-hand display. This line DOES NOT NEED TO BE CENTERED OVER THE PEAK, it only needs to “touch” it. You will most likely not see it centered over the peak very often and that is fine.
16) If the thick line that corresponds with the gas does not touch the peak, then you need to pick the peak. To do this:
a) Click on the button at the right which corresponds to the peak in question.
b) Drag your mouse to the left and you will see a flashing vertical line. Place this as exact on the tip of the peak as you can, and double-left click your mouse.
c) If done correctly, you will get a small pop-up window indicating the number of “seconds” at which the peak was placed.
17) For Peak Picking to be viewed/checked, you need to wait for the Chromatograph cycle to finish through one complete cycle. It is safe to wait 16 minutes and look at the last complete Chromatograph cycle’s graph in order to determine whether you picked them properly.
18) If you didn’t get them right, it’s ok – just re-pick them and check again. This is an iterative tuning process that may take a few tries.
19) PITFALLS TO AVOID:
a) Picking peaks too close together (within 12 seconds of one another) will produce unpredictable results.
b) When Ethane is a “shoulder” instead of a “peak”, pick the peak on the “right hand corner” of the shoulder to avoid having the thick line “creep” up the Methane curve and skew your results.
c) Control the temperature of your trailer and more specifically the Bloodhound itself. A falling or rising temperature in the Bloodhound during the 8-minute Chromatograph cycle time will produce unpredictable results.
d) If in your LAS export files you see that C1 and C2 or similar have “switched”, there is a problem with the peaks and it is a good time to go in and conduct a peak-picking exercise.
e) If you use this procedure to try to pick peaks with a Remote (network) Gas Chart instance, it will not work unless you are in “Two-Way Active” mode, which can be accessed on the Bloodhound tab in setup.
f) When picking peaks from a Local Gas Chart instance (connected with a USB Cable in the trailer) do NOT set Gas Chart into Two-Way mode.
Congratulations! You have “Picked Peaks” locally